
Graph Shows Radio And Television Audiences Throughout The Day In 1992 IELTS Academic Writing Task 1
- Coaching in Delhi
- Coaching in Chandigarh
- Coaching in Hyderabad
- Coaching in Mumbai
- Coaching in Bangalore
- Coaching in Chennai
- Coaching in Gurgaon
- Coaching in Kerala
- IELTS Writing Tips
- Academic Listening Tips
- Best Way for IELTS Prep
- Coaching in Pune
- Coaching in Ernakulam
- IELTS Coaching Amritsar
- IELTS Classes Ahmedabad
- IELTS Coaching in Kolkata


Experta en el extranjero | Updated On - Nov 9, 2022
Graph Shows Radio And Television Audiences Throughout The Day In 1992 IELTS Academic Writing Task 1 sample answer is given below. The candidates are required to present a tentative answer for the same. Graph Shows Radio And Television Audiences Throughout The Day In 1992 IELTS Academic Writing Task 1 requires candidates to write a summary or overview based on a diagram, a table, a line graph, or a bar graph in at least 150 words. IELTS academic writing task 1 is a writing task for 150 words. Candidates are given 20 minutes and are required to write a summary for IELTS Academic writing task 1. IELTS writing score is marked based on band scores. The band scores range from 0 to 9. Meanwhile, candidates might consider practising from IELTS writing practice papers to help excel your writing skills.
Check: Get 10 Free IELTS Sample Papers
Check: Register for IELTS Coaching - Join for Free Trial Class Now
Topic: The graph below shows radio and television audiences throughout the day in 1992. Summarise the information by selecting and reporting the main features, and make comparisons where relevant.
Band 6 Answer
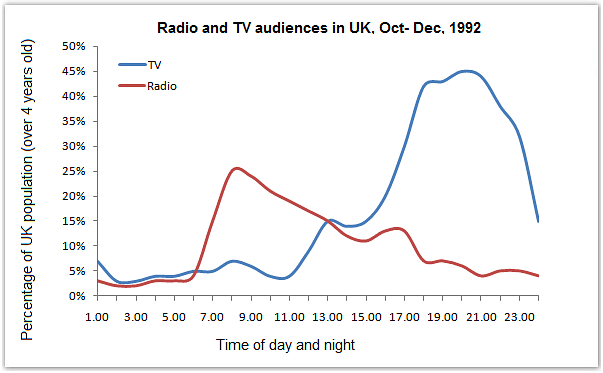
The provided line graph displays information on radio and television audiences in the UK for a day in the months of October through December of 1992. The graph shows that individuals prefer to watch television programmes more than listen to the radio between the hours of 1:00 pm and 11:00 pm. They prefer to listen to the radio between the hours of 5:30 am and 1:00 pm.
Only about 5% of people over the age of four were found to be watching or listening to television at 1:00 in the morning, according to the line graph. Until 5:30 the following morning, this percentage remained essentially unchanged. Then, at around 9:00 am, the radio audiences dramatically surged and reached a level of about 25%. On average, 5% of the population watched TV during this time, which is a very small percentage. After 9:00 in the morning, the percentage of listeners to the radio kept dropping. It reached 5% at 7:00 in the evening and stayed there until the next morning. The percentage of TV viewers, on the other hand, grew after 2:30 pm and peaked at 45% at about 9:30 pm. In conclusion, 25% of UK residents listened to the radio between 5:30 am to 1:00 pm. While over half of the country's population watched television from 5:30 pm to 9:30 pm.
Band 6.5 Answer
According to the presented line graph, a certain percentage of people either listened to the radio or watched TV during the day or at night. Between October and December 1992, this study was conducted among the population of the UK. When we first look at the graph, we can see that no one was watching TV at this time of day.
But 7% of the UK population began listening to the radio at 6:00 a.m. The radio audiences gradually grew until they peaked at 26% of listeners at 8.30 am. Then, this pattern gradually decreased until it reached only 4% of the audience at 6 o'clock. We can unequivocally state that most people listened to the radio before leaving for work or while travelling to their place of employment. However, when it comes to TV audiences, it's clear that most people were watching it between 6:00 and 10:00 p.m. It was with the largest percentage hitting 45% at 8:00 p.m. In conclusion, people in the UK spent more time watching TV in the late afternoon after they got home from work and before going to bed. Much more than they listened to the radio in the morning before going to work.
Band 7 Answer
The line graph shows the proportion of British audiences who listened to radio and watched television continuously in 1992. Radio is utilised more frequently in the morning than at night, according to the graph overall. The biggest number of people watched television in the evening as opposed to the morning.
As seen in the graph, 8% of respondents were listening to the radio at 6 a.m., compared to 0% of respondents who watched television at that hour. Remarkably, the proportion of radio listeners had climbed by roughly 28% at 8 a.m. The number of individuals watching television did, however, marginally increase during that period, rising by about 8%. The trend of the UK population's radio listening percentage had significantly reduced at 2% from 8 a.m. to 2 p.m. of midnight time. On the other side, surprisingly, television viewership increased starting at lunchtime and continued until 8 p.m. In the two hours leading up to 2 p.m. after 10 p.m., the number of TV viewers dropped quite sharply by 4%. Radio and television audiences both saw a tiny 4% uptick around six in the morning. Finally, it can be said that people in the UK spend more time watching TV in the late evening before going to sleep. More than they did listening to the radio in the morning hours before leaving for work.
Check- IELTS Writing Samples
- Percentage of The Population by Age Groups in One Town Who Rode Bicycles in 2011 IELTS Writing Task 1
- Percentage of Land Covered by Forest in Various Countries in 1990 And 2005 IELTS Writing Task 1
- Line Graph Showing Percentage of Car Ownership in Great Britain IELTS Writing Task 1
- The Percentage Of Water Used By Different Sectors Pie Chart IELTS Writing Task 1
- Two Pie Charts showing the Percentages of Energy IELTS Writing Task 1
- A Charts Below Show the Banana export in 1993 and 2003 IELTS Writing Task 1
- Percentage of People Living Alone in 5 Different Age Groups in the US IELTS Writing Task 1
- Computer Ownership as a Percentage of the Population IELTS Writing Task 1
- The Percentage of Female Members of Parliament in 5 European Countries - IELTS Writing Task 1
- Global Population Percentages and Distribution of Wealth IELTS Academic Writing Task 1
- Maps showing changes that took place in Youngsville in New Zealand IELTS Writing Task 1
- Diagrams showing the manufacture of frozen fish pies IELTS writing task 1
- Plans showing a public park when it first opened in 1920 and the same park today IELTS Writing Task 1
- Total number of Olympic medals won by twelve different countries IELTS Writing task 1
- Percentage of five kinds of books sold by a book seller IELTS Writing task 1
- Average percentages in typical meals of three types of nutrients IELTS writing task 1
- Bar chart showing the different modes of transport used to travel to and from work IELTS writing task 1
- Bar Graph showing hours per week that teenagers spend doing certain activities in Chester IELTS Writing Task 1
- Map Showing Road Access to a City Hospital in 2007 and in 2010 IELTS Writing Task 1
- The value of one country’s exports in various categories during 2015 and 2016 IELTS Writing Task 1
*The article might have information for the previous academic years, please refer the official website of the exam.